
Advanced Skills - Statistics
An ANOVA compares the sample means between three or more levels of an independent categorical variable.
The assumptions of an ANOVA are that the distribution of the dependent variable at each level of the independent variable are approximately normal.
Also the variances of the dependent variables at each level of the independent variable are about equal.
Both these assumptions can be estimated from examining histograms of the data. The variance assumption can also be tested while conducting the ANOVA test.
The videos on the comparing means page guide you through the process step by step. But as a quick reference:
In SPSS:
Analyse -> Compare Means -> One Way ANOVA
Add your dependent variable to the list of dependent variables
Add the independent variable to the ‘Factor’ box
Click on ‘Options’ and then the box for Homogeneity of Variance Test
Click OK on this box, the OK to run the ANOVA
In R:
Set working directory to where the data file is stored
Load in data using: data1 <- read.csv('filename.csv')
Attach the data: attach(data1)
run the test: analysis1 <-aov(dependent ~ indpendent)
Changing the names of the variables to what they are called in your data.
type the command: summary(analysis1)
to get the ANOVA table
run the command plot(analysis1) and/or fligner.test(dependent ~ independent) to check assumptions
From SPSS you get a data table which looks like this:
Typical output from a Levene's test for equal variances
Typical output from an ANOVA test - note, these tables are not from the same dataset
Firstly, look at the Levene's test. If the p value (sig level) is greater than 0.05, then you can assume the variances are equal and therefore look at the results of the ANOVA. If the Levene's lest p value is less than 0.05, you may want to consider running a non-parametric test, in this case a Kruskal Wallis test.
A p value (significance level) of less than 0.05 for the ANOVA means that the sample means between the different levels of the category are different.
When reporting the output of an ANOVA you reference the F value, and also the between group and within group degrees of freedom (4 and 25 in the example table above).
From R you get output which looks like this:
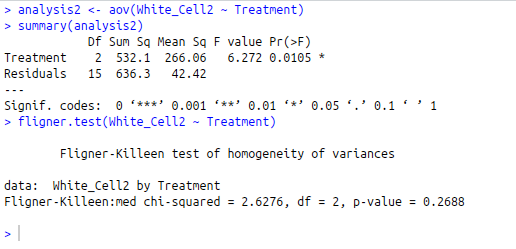
The outputs for the homogeneity of variance test and the ANOVA are interpreted the same way as the p value for SPSS above (the p value is labelled as Pr(>F), don't worry about this, it's just a p value). If the p value is less than 0.05, then the difference between the sample means is considered significant.
When reporting the data, you again need the F statistic and the two different degrees of freedom. Here they are called 'Treatment' and 'Residual' and have the values 2 and 15.
DO NOT copy and paste output of SPSS or R into your work - unless you are specifically asked to put it in an appendix. ANOVAs are simple tests, and can usually be summarised in a single line of text in your results section.
Examples:
There was a significant difference between the blood cell counts of the different treatment groups (ANOVA F = 6.27, d.f. = 2 and 15, p = 0.011)
There was no significant difference between the number of squirrel drays found in oak trees, chestnut trees and ash trees (ANOVA, F=0.125, d.f. = 2 and 27, p = 0.35)
You may also want to include the mean values in the text, or refer to a bar chart of the output - formatted as per the guidelines last year.
Back Next
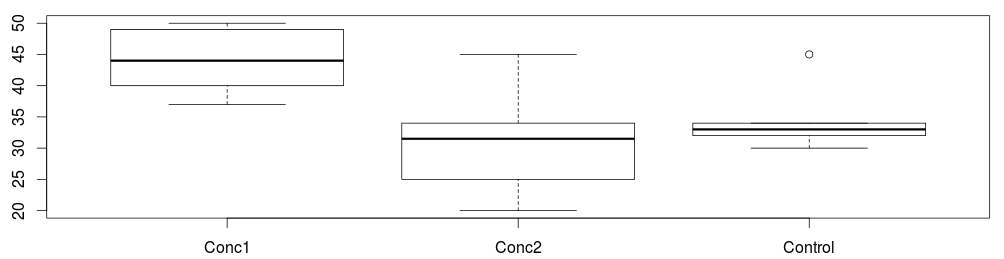
Don't forget to draw graphs of your data too. Either when exploring the data, or after the analysis. This allows you to examine the magnitude of difference between means, and lets you decide whether differences are likely to be important, even if they are statistically significant.
Other tests