
Advanced Skills - Statistics
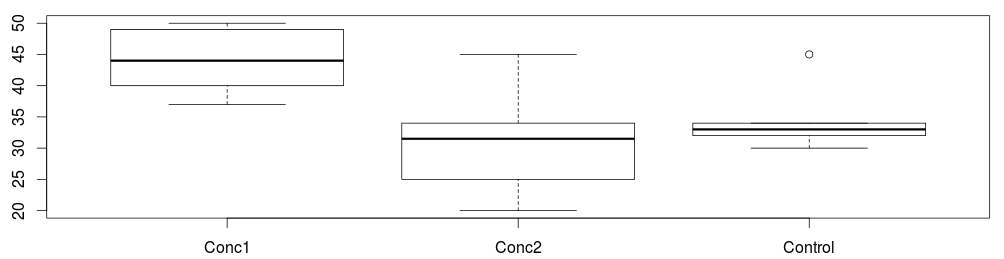
The following are professionally made graphs from recent published journal articles. You can see there are scatterplots and bar charts, which are exactly as you were taught to make last year. The difference between them is the scatterplot has a continuous independent variable, where as the bar chart has a categorical independent variable.
For a reminder of how to make graphs like this, you can visit this tutorial
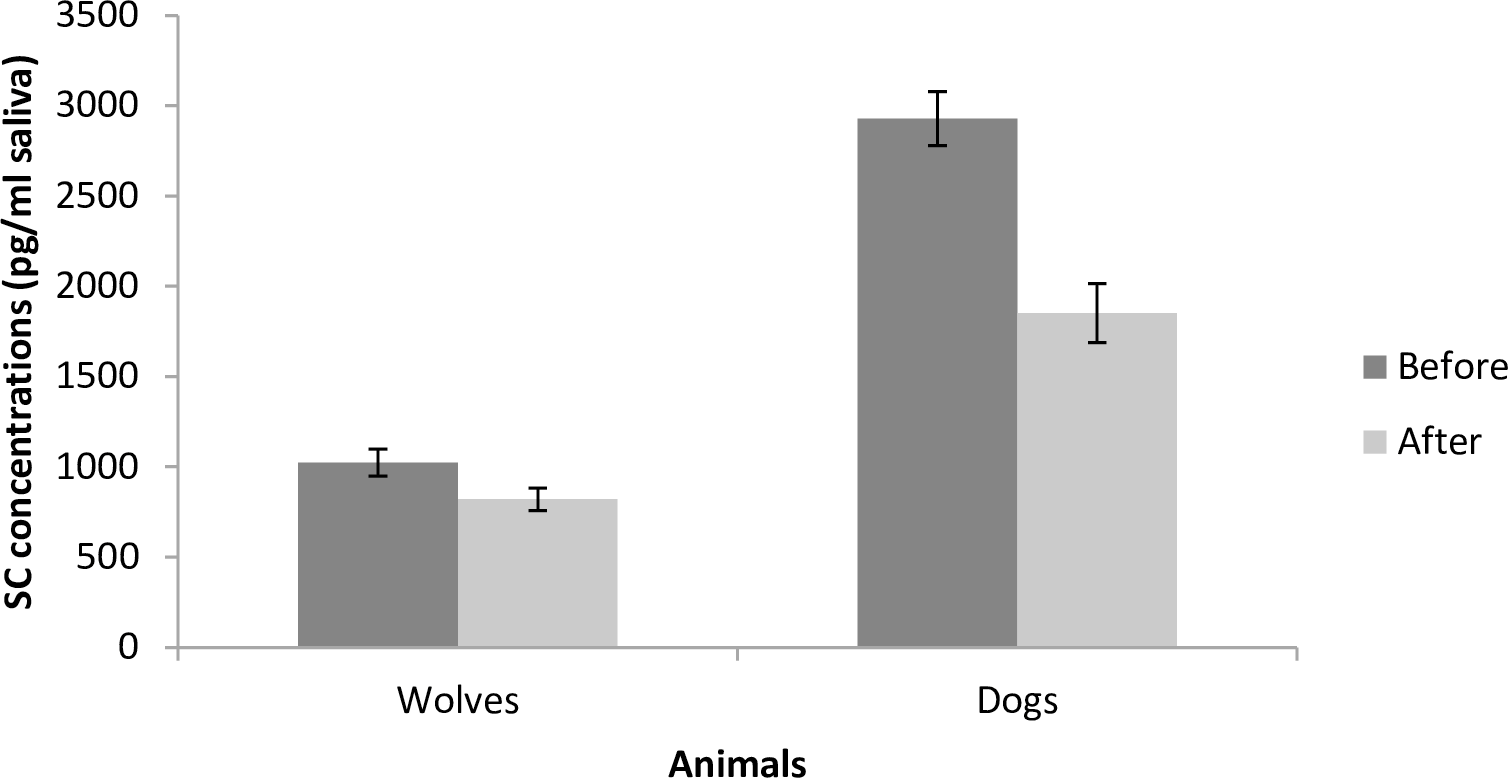
Fig 3. Mean SC concentrations (±SE) in samples collected from wolves and dogs (1) before and (2) 15 minutes after the end of the training sessions.
Figure from Vasconcellos et al. (2016)
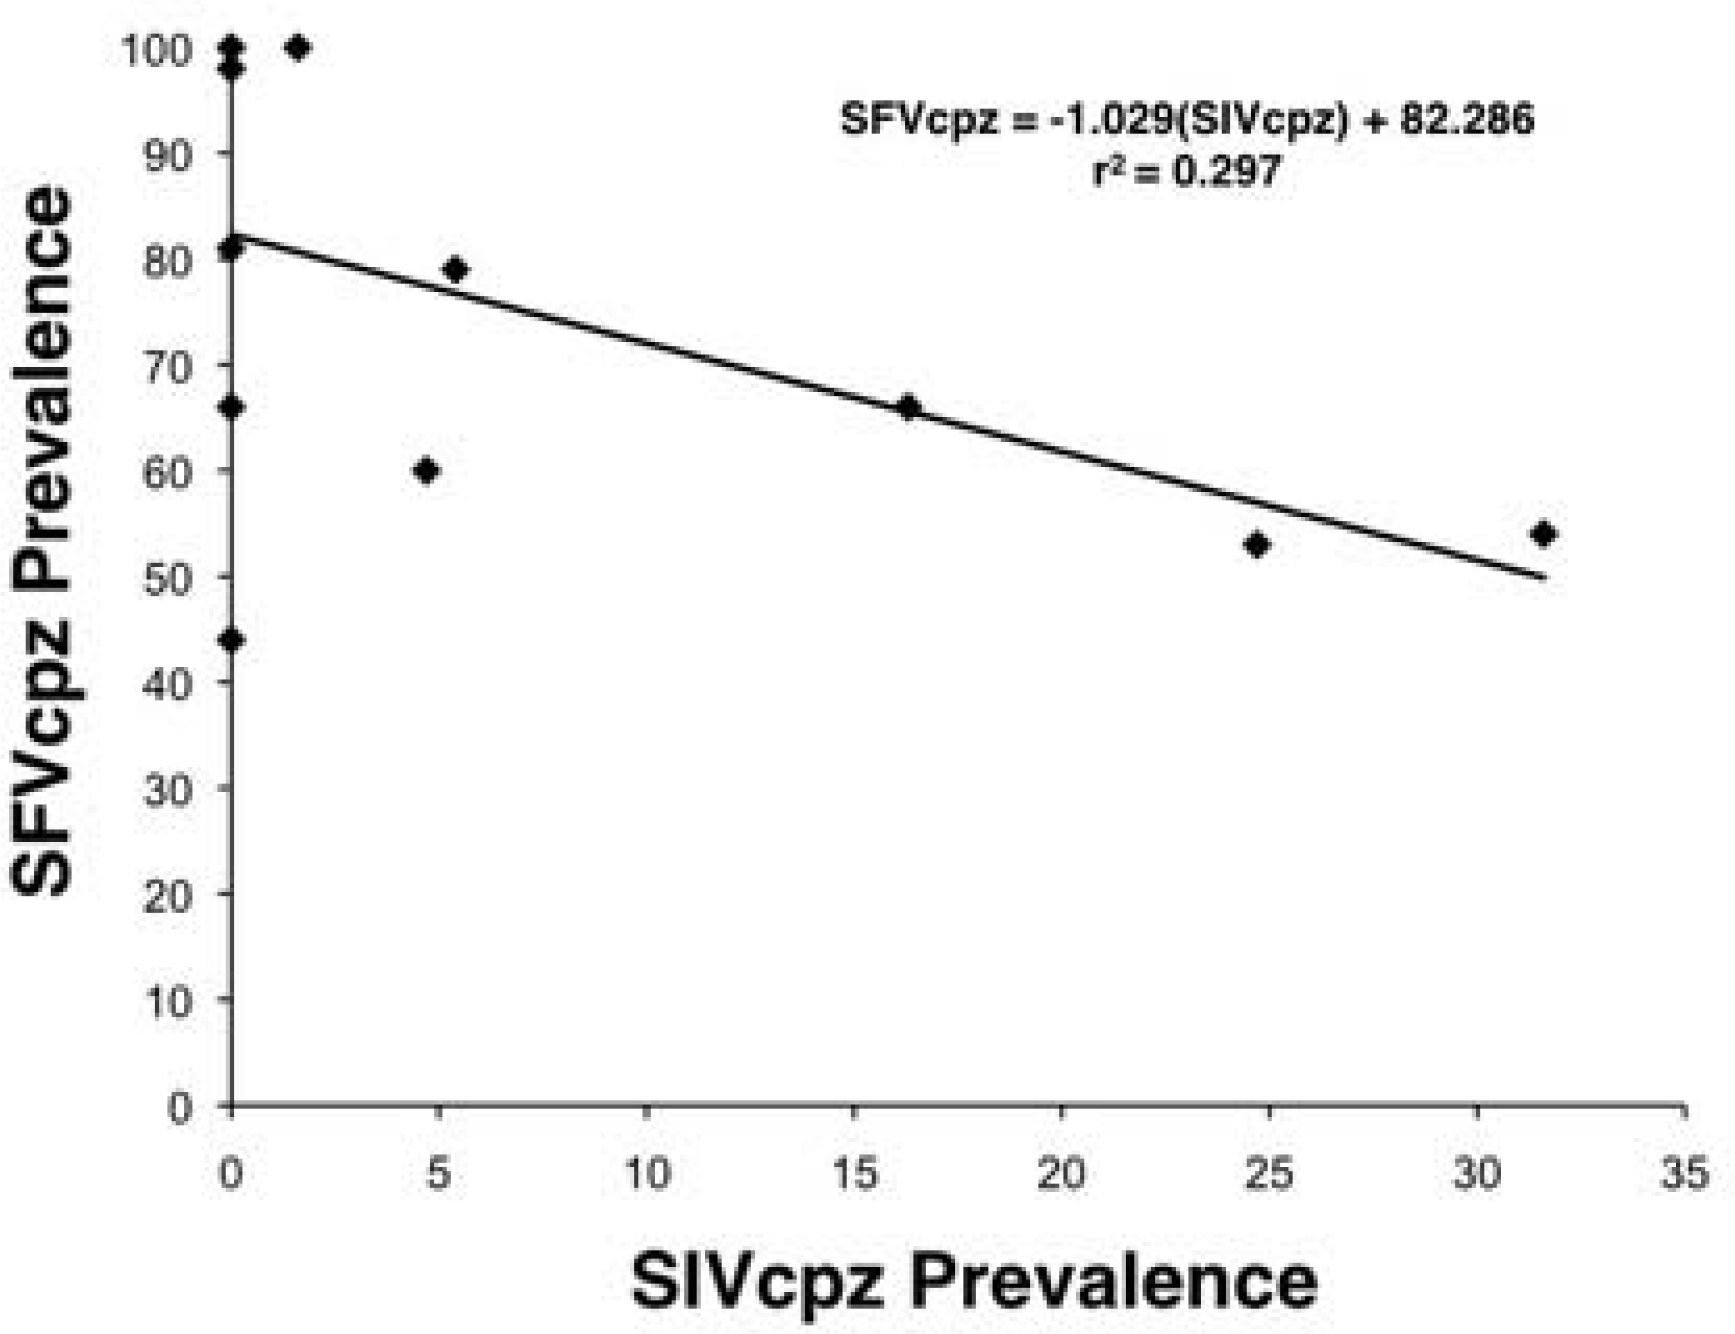
Fig 6. Regression analysis of SFVcpz prevalence on SIVcpz prevalence in Pan troglodytes ellioti (3 populations) and > Pan troglodytes troglodytes (9 populations) from Cameroon.
Figure from Locatelli et al. (2016)
Back Next
Refresh your memory about how to produce graphs like this by using the links to last year’s tutorials.
Other tests