
Advanced Skills - Statistics
If you follow the decision flowchart to work out which test you would use to analyse your data, you may get to the point of 'other tests'. One recommendation is to reconsider how you are going to collect your data.
While Fisher's exact test and the Chi squared test are perfectly good tests and have a variety of uses, they are often used as a last resort to put together a rather poor quality analysis on data which could have been much better collected if a little planning was conducted beforehand.
The reason for this is that Fisher's exact tests and Chi squared tests do not necessarily require replicates in the same way as the other tests considered in the tutorial (e.g. ANOVA and regression).
A correct use of a Fisher's exact test is to determine differences in a 2x2 contingency table. This will be explained a bit more below. First an example:
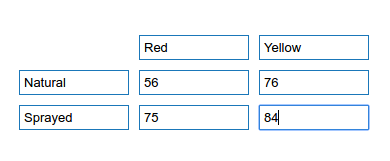
We are trying to investigate whether bees are more attracted to the colour of a flower or its sugar content. As a first experiment, we select two different colour varieties of the same plant (sweet peas as an example). We count the number of bees visiting the plants over a 1 hour period and find that 56 bees have visited the red flowers and 76 bees have visited the yellow flowers. We then spray all the red flowers with a sugar solution to try to increase the sugar content. After another hour of counting, we find that 75 bees have visited the red flowers and 84 bees have visited the yellow flowers.
We could use Fisher's exact test to determine whether spraying the red flowers has made them more attractive to the bees, or whether the change in numbers is just down to chance.
You can write these data up in a contingency table as shown:
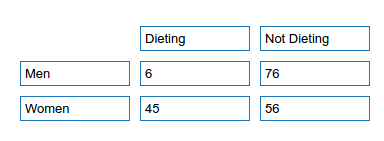
A second example (taken from Wikipedia). A sample of teenagers might be divided into male and female on the one hand, and those that are and are not currently dieting on the other. We hypothesize, for example, that the proportion of dieting individuals is higher among the women than among the men, and we want to test whether any difference of proportions that we observe is significant.
We can set up a contingency table as such:
While it is possible to run Fisher's exact tests from SPSS or R, it is not intuitive or easy to do so. However, there are good online tools to run the analysis.
A good calculator for Fisher's exact tests can be found here.
There is a video of how to perform analysis using the online graph pad software here. However, it is very intuitive to use, and basic instructions are given below:
1. Go to the Graph Pad contingency table webpage http://www.graphpad.com/quickcalcs/contingency1.cfm
2. Enter your data in the contingency table form, as seen above.
3. Make sure you select the default values of 'Fisher's Exact Test' and 'Two tailed test'
4. Click 'Calculate now'
You will then get the results, which will only include a p value. Remember that you need a p value of less than 0.05 to conclude that there is a significant difference in your contingency table (i.e. bees forage more on red flowers once sprayed, more females than males are on diets).
You could write up the results of the Fisher's exact test in the video and bee example above as follows:
There was no significant difference in how bees distinguished between different coloured flowers before and after spraying red flowers with sugar solution (p = 0.478).
Back Next
Remember to plan statistical analysis when you think of any kind of data collection process. It is good to know how you will analyse your data, and it can help you avoid common data collection mistakes if you do think of the analysis method.
Other tests