
Advanced Skills - Statistics
Correlations are used to test for relationships between two variables, even if there is no 'cause and effect' between them.
Videos demonstrating how to perform correlations are available on the previous pages. The following however, gives a quick overview.
In SPSS:
->Analyse -> Correlate -> Bivariate
Put both variables into the variables box.
Check Pearson’s correlation (for parametric) or Spearman's (for non-parametric)
Click Run
In R:
Set working directory to where the data file is stored
Load in data using: data1 <- read.csv('filename.csv')
Attach the data: attach(data1)
run the test: cor.test(dependent, independent, method = 'pearson')
or: cor.test(dependent, independent, method = 'spearman')
Typical output from a correlation looks like this:

Download larger image here.
To interpret the correlation, firstly look at one of the boxes with a significance value. Both of these boxes have identical data. Now look at the p value. If this is less than 0.05, then there is a significant relationship between the variables.
Next, if, and only if, the p value indicates significance, look at the r2 value. The higher this is, the stronger the relationship. An r2 of more than 0.4 is a fairly strong relationship for field studies. More than 0.7 would be considered fairly strong for most biological lab work. More than 0.9 would be required for subjects such as physics and chemistry. r values would need to be higher for the same strength of relationship to occur.
Interpreting and reporting the R output:
Typical output from R looks like this:
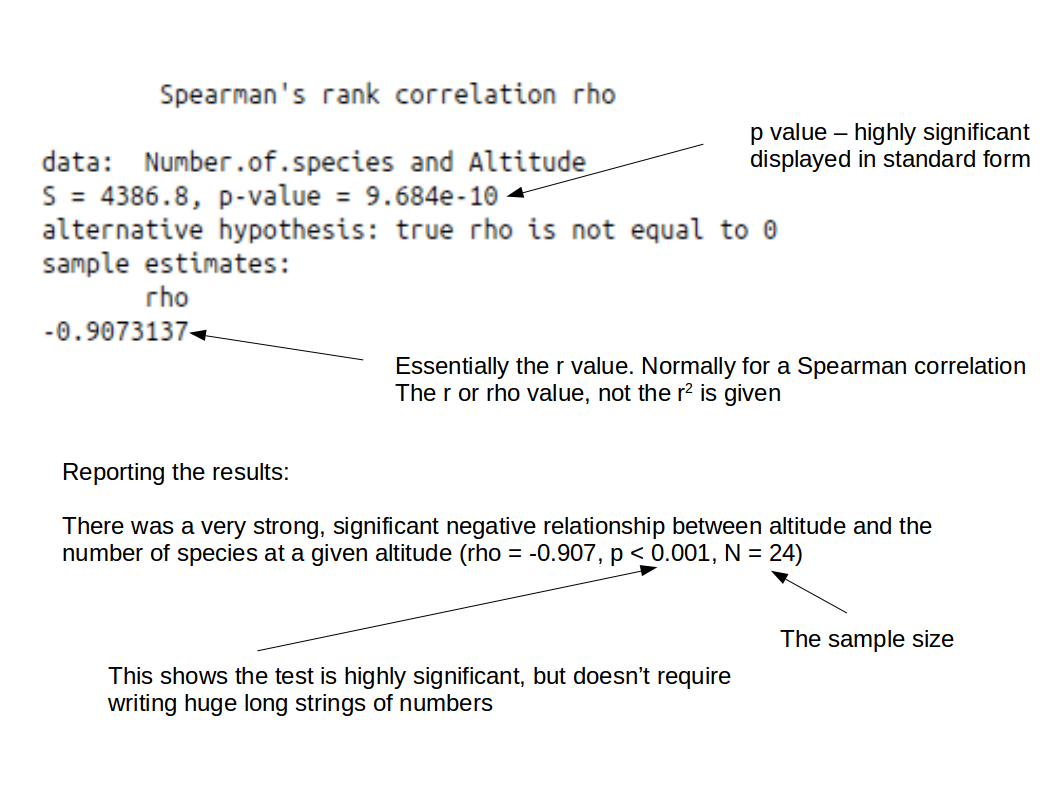
Download larger image here.
Other than understanding the p value is in standard form, interpretation is the same as for SPSS above.
You may also want to refer to a scatterplot of the output - formatted as per the guidelines last year.
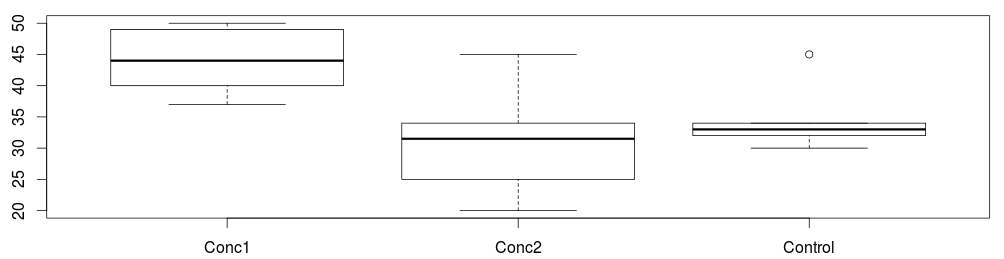
Don't forget to draw graphs of your data too. Either when exploring the data, or after the analysis. In some cases, the best fit may not be a straight line. Often a Spearman rank correlation can be better if this is the case.
Other tests