
Advanced Skills - Statistics
For statistical analysis data need to be set up in a specific way. In some cases this seems confusing at first, but the good news is that it is identical for categorical or continuous variables.
Many people set up data something like the picture below:
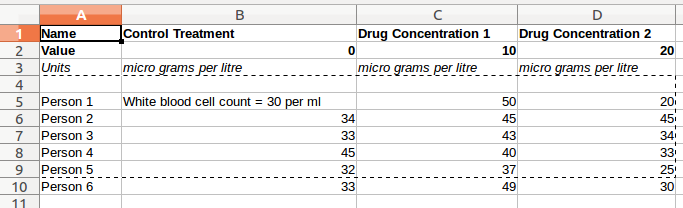
However, this is not easy to deal with in statistics programs. You need to set up data in two columns. One for the independent variable and one for the dependent variable.
In this tutorial, you will only ever have one dependent variable and one independent variable. You may have an independent variable which is categorical, with five levels (or categories – as in the t-shirt example), but you only have one independent variable.
There are two ways to set up these data for analysis. It depends whether you want to have a categorical or continuous independent variable.
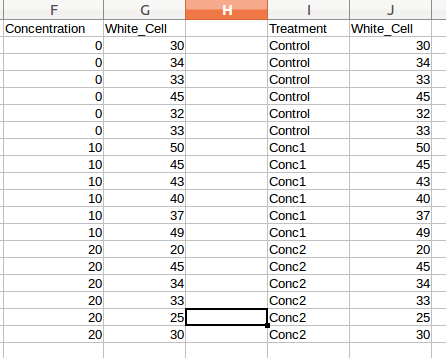
The data on the left are identical to those on the right. However, the independent variable has been coded differently - once as a number (continuous) and once as words (categorical). Compare this with the way the data were initially formatted. You can't readily identify the independent variable in this first picture. It's important to realise that 'person' is not the independent variable. Each person is a replicate.
There are a few things to note with these examples:
1) Cells with numbers in them contain no other information (no units, no text of any kind)
2) Text in cells contains no spaces and is restricted to one word only. It is especially important never to use commas in text cells (which is important if you are from a country where commas are used rather than decimal points)
2) There is a header for each column – this contains no spaces and it is in the first row (and only the first row) of the spreadsheet.
3) For SPSS, it can be best to always code variables using numbers (as per the data on the left), as some tests do not you select independent variables which contain words. For R, it is best to use words for the different categories, so it can not mistake the variable as continuous.
While you may be able to break some of these guidelines, it is best to stick to them, as it can save strange things happening to your data.
Back Next
In some more complicated statistics, you may have more than one independent variable. As each independent variable is coded in a column, formatting your data like this always works, even for more complex statistics.
Other tests