
Advanced Skills - Statistics
A t-test compares the sample means between two levels of an independent categorical variable.
The assumptions of a t-test are that the distribution of the dependent variable at each level of the independent variable are approximately normal.
Some t-tests also have a assumption about equal variance - however, as you can see from the results of the tests (below), you don't need to worry about this at the moment.
The videos on the comparing means page guide you through the process step by step. But as a quick reference:
In SPSS:
Analyse -> Compare Means -> Independent Sample t-test
Test Variables = dependent variable
Grouping Variable = independent variable
Need to click ‘define groups’ and specify the names of the levels of the independent variable
In R:
Set working directory to where the data file is stored
Load in data using: data1 <- read.csv('filename.csv')
Attach the data: attach(data1)
run the test: t.test(dependent ~ indpendent)
Changing the names of the variables to what they are called in your data.
From SPSS you get a data table which looks like this:
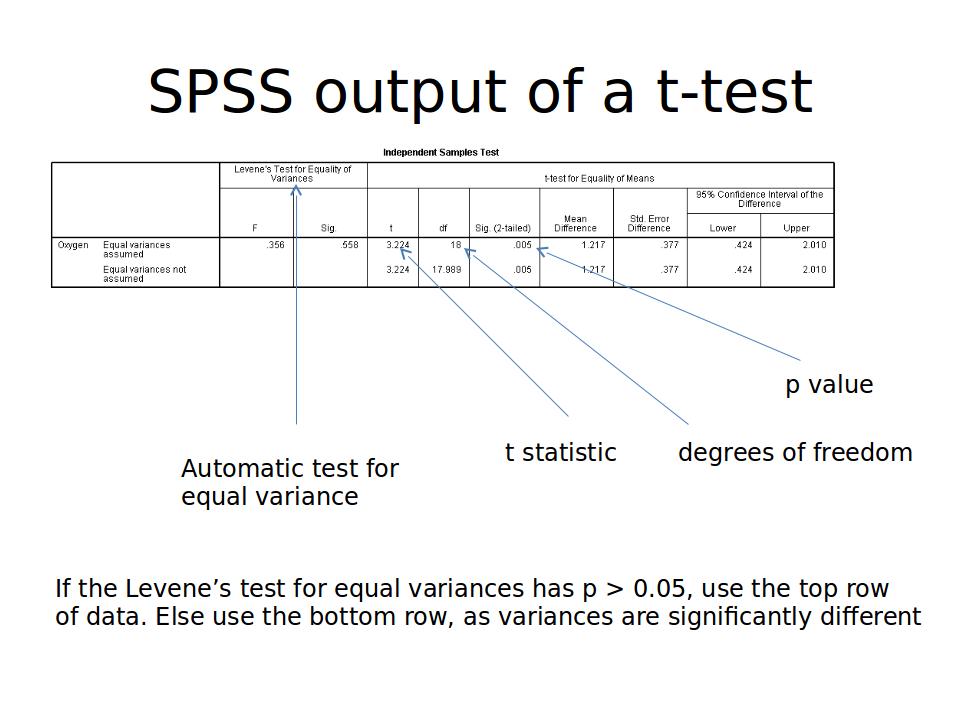
Firstly, look at the Levene's test. If the p value (sig level) is greater than 0.05, then you can assume the variances are equal and look at the top row of data for the t-test. If the Levene's lest p value is less than 0.05, look at the bottom row.
A p value (significance level) of less than 0.05 for the t-test means that the sample means between the two levels of the category are different.
From R you get output which looks like this:

As a default, R automatically chooses a t-test which doesn't not require equal variances. It is interpreted the same way as the p value for SPSS above. If the p value is less than 0.05, then the difference between the sample means is considered significant.
Usefully, the mean values for each level of the independent variable are also given in the bottom row of the output.
DO NOT copy and paste output of SPSS or R into your work - unless you are specifically asked to put it in an appendix. T-tests are simple tests, and can usually be summarised in a single line of text in your results section.
Examples:
There was a significant difference between the height of males and females at age 18 (t-test, t=3.23, d.f. = 18, p < 0.05)
There was no significant difference between the number of squirrel drays found in oak trees and ash trees (t-test, t=0.21, d.f. = 10, p = 0.35)
You may also want to include the mean values in the text, or refer to a bar chart of the output - formatted as per the guidelines last year.
Back Next
SPSS can give a lot of output from statistical tests. Most of this you do not need to look at. Make sure you know what tables and output you need.
Other tests