
Advanced Skills - Statistics
There are non-parametric versions of t-tests and ANOVA, which work when you have two levels or three or more levels of an independent categorical variable respectively.
While non-parametric tests still have assumptions, the transformations in 'ranking' the data are likely to mean that the assumptions will be met - as such, it is often assumed there are no assumptions about your data, and these assumptions are certainly never tested.
You would use non-parametric tests in the following cases:
1. Your data are ordinal
2. Histograms or other plots show major departures from normality
3. Variances were significantly different in an ANOVA test
A non-parametric ANOVA is called a Kruskal Wallis Test
A non-parametric t-test is called a Mann Whitney U Test or a Willcoxon Test
The videos on the comparing means page guide you through the process step by step. But as a quick reference:
In SPSS:
Analyse -> Non-Parametric -> Legacy Dialogues
2 independent samples for Mann Whitney ‘t-test’
K independent samples for Kruskal Wallis ‘ANOVA’
In R:
Set working directory to where the data file is stored
Load in data using: data1 <- read.csv('filename.csv')
Attach the data: attach(data1)
run the test: wilcox.test(dependent ~ independent)
or: kruskal.test(dependent ~ independent)
Changing the names of the variables to what they are called in your data.
From a Mann Whitney test in SPSS you get a data table which looks like this:
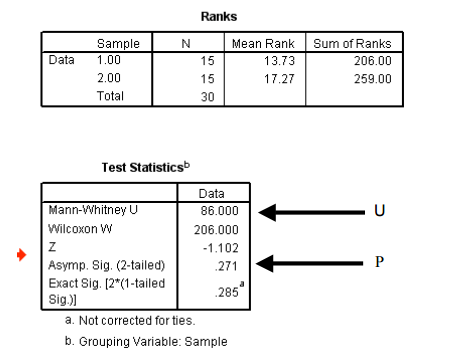
The p value is for some reason called the Asymp. Sig.
As before p value (significance level) of less than 0.05 for the Mann Whitney test means that the sample averages (here they are medians) between the different levels of the category are different.
Typical output from a Kruskal Wallis test:
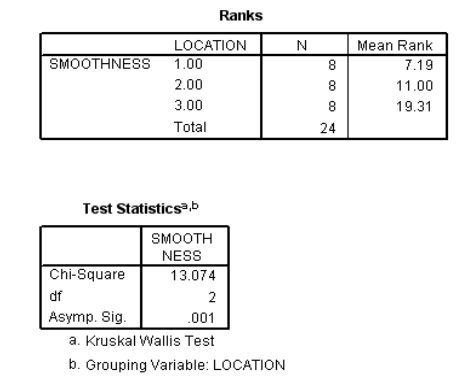
Again, the p value is for some reason called the Asymp. Sig.
As before p value (significance level) of less than 0.05 for the Kruskal Wallis test means that the sample averages (here they are medians) between the different levels of the category are different.
From R you get output which looks like this:
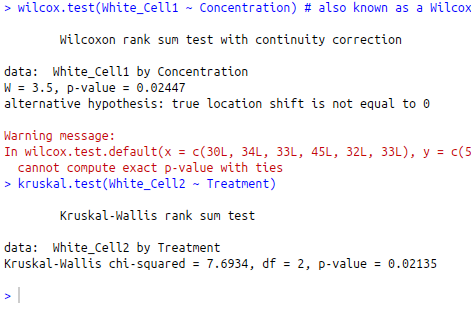
Note, different data has been analysed here compared to the SPSS examples. However, the p values should be easy to see, and are interpreted in exactly the same way.
Note - R produces a W statistic for the Mann Whitney test, where as SPSS produces a U statistic. Both are the same thing
Also note - R has produced a warning message here. Ranking data can sometimes cause ties, and such messages are common with small datasets. Don't worry about warning messages when the results seem to make sense, and support what you would have found from looking at graphs.
DO NOT copy and paste output of SPSS or R into your work - unless you are specifically asked to put it in an appendix. These tests are simple tests, and can usually be summarised in a single line of text in your results section.
You would report the test statistic and p value for each test. Where possible also report degrees of freedom. If you can't do this, as there are no degrees of freedom given for the Mann Whitney test, then provide the sample size (the full number of samples, across all levels of the independent variable.
For example, if I had six replicates in each of my two treatments then N = 12
Examples:
There was a significant difference between the blood cell counts of the different treatment groups (Mann Whitney U = 3.5, N = 12, p = 0.0245)
There was a significant difference between the number of squirrel drays found in oak trees, chestnut trees and ash trees (Kruskal Wallis, Chi-squared=7.70, d.f. = 2, p = 0.0214)
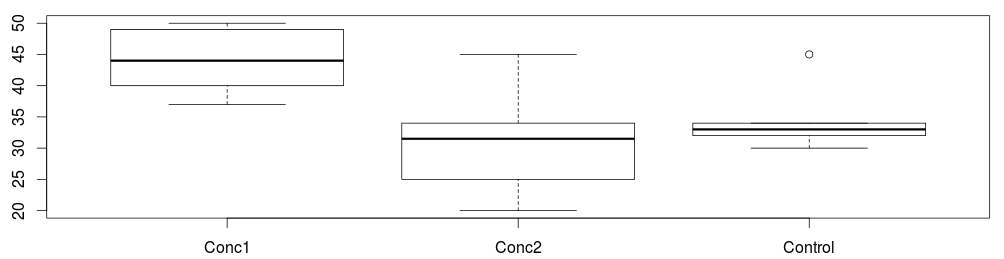
You may also want to include the median values in the text, or refer to a bar chart (or box plot) of the output - formatted as per the guidelines last year.
Back Next
SPSS can give a lot of output from statistical tests. Most of this you do not need to look at. Make sure you know what tables and output you need.
Other tests