
Advanced Skills - Statistics
If you follow the decision flowchart to work out which test you would use to analyse your data, you may get to the point of 'other tests'. One recommendation is to reconsider how you are going to collect your data.
While Fisher's exact test and the Chi squared test are perfectly good tests and have a variety of uses, they are often used as a last resort to put together a rather poor quality analysis on data which could have been much better collected if a little planning was conducted beforehand.
The reason for this is that Fisher's exact tests and Chi squared tests do not necessarily require replicates in the same way as the other tests considered in the tutorial (e.g. ANOVA and regression).
Chi squared tests can be used to determine differences in a 2x2 or larger contingency tables in the same way as Fisher's exact tests are used, but here we will examine their use in comparing observed values with expected values. This is something you may have already covered in genetics at A-level.
Let's suppose we are trying to work out if a gene from a GM crop has become established in a wild population. The GM plant is resistant to herbicide. It has two alleles of a resistance gene which cause this resistance. Normal wild plants have two alleles of the gene which are not resistant to the herbicide. The gene's alleles are co-dominant. So, if it has two alleles which are resistant, then most plants will survive after spraying with a mild dosage of the toxin (about 5% won't). If it has two alleles which are non-resistant, then most plants will die when sprayed with toxin (again, about 5% won't). If it has one resistant allele, then it will most likely survive, but show signs of illness.
If the resistant allele has not spread to the wild population, then all offspring between crosses must be heterozygous (one allele resistant, one allele non-resistant).
As such, our expected values would be
Mortality = 5% ; Illness = 90% ; no symptoms = 5%
We grew 232 plants, with 6 showing mortality, 212 showing illness and 14 showing no symptoms.
You can write these data up in a table as shown:
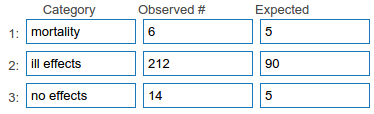
We can compare whether the observed values differ significantly from the expected values using a Chi squared test. If there is a significant difference, it may be possible to conclude that GM alleles have found their way into the wild population.
Note, it is important to use actual numbers in the 'observed values' column. This effects the power of the analysis. If you use a percentage, you will get different results. You can use a number, percentage or proportion in the 'expected values' column. If you use a number, then in total the column must add up to the same value as the observed values column. If you use a percentage or proportion, then the column must add up to 100 (or 1) - or at least to > 99.5% (see the second example)
A second example illustrates how a Chi squared test can sometimes be used, but it is not the ideal use for the test, and thinking about data analysis would have resulted in a much better analysis for very little more work in the field.
A student has been collecting data in the Amazon rainforest. They were trying to find out if pristine areas of the forest had more howler monkeys than degraded areas and recovering areas (previously degraded). They visited 20 different sites of approximately equal area in each of these forest classifications, and recorded whether howler monkeys were present.
19 pristine sites, 6 degraded sites and 18 recovering sites had howler monkeys present.
While this data is useful, the student would have been better to have run a timed survey at each site, and counted the number of howler monkeys in each survey. This would then provide 60 pieces of replicate data, and could be analysed by ANOVA. Where possible, replicates should be taken and each replicate should have a piece of data associated with it, which is a number.
As it is, we can analyse these data with a Chi squared test, but it is not ideal. To do so, we set up a null hypothesis, that the number of howler monkeys is identical in each type of forest. We set this as our expected values, in a table like this:
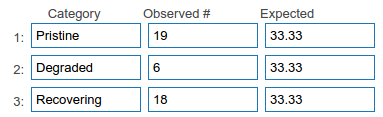
We then run a Chi squared test to see whether the null hypothesis can be rejected. If the observed values are significantly different to the expected values, then we can conclude that different types of forest have different levels of occurrence of howler monkeys.
While it is possible to run Chi squared tests from SPSS or R, it is not intuitive or easy to do so. However, there are good online tools to run the analysis.
A good calculator for Chi squared tests can be found here.
There is a video of how to perform analysis using the online graph pad software here. However, it is very intuitive to use, and basic instructions are given below:
1. Go to the Graph Pad Chi squared webpage http://www.http://www.graphpad.com/quickcalcs/chisquared1/
2. Enter your data in the table form, as seen above.
3. Make sure you select the correct version of your expected values (percentage, actual number etc).
4. Click 'Calculate now'
You will then get the results, which will include a p value, a Chi squared statistic and the degrees of freedom. Remember that you need a p value of less than 0.05 to conclude that there is a significant difference between your observed and expected values.
You could write up the results of the Chi squared tests in the video as follows:
There was no significant evidence that the GM resistant allele had spread to the wild population (Chi squared = 3.25; d.f. = 2, p = 0.197).
Howler monkey presence was significantly different between areas of the forest with different levels of degradation Chi squared = 7.30; d.f. = 2, p = 0.026).
Back Next
Remember to plan statistical analysis when you think of any kind of data collection process. It is good to know how you will analyse your data, and it can help you avoid common data collection mistakes if you think of the analysis method.
Other tests