
Advanced Skills - Statistics
When you have a categorical independent variable, the normal test is to compare the averages of each level of that variable. Where possible, it is normal to compare the mean values. These tests are generally referred to as parametric tests and are generally more powerful (i.e. better) than non-parametric tests which rank your data into order, and then compare medians. Essentially, ranking your data is an extreme data transformation. You should be familiar with data transformations, especially if your dependent variable is a direct count (e.g. number of individuals), or a percentage. However, in many cases, you don't need to worry unduly about data transformations.
The premise of tests which compare means is as follows:
In statistics you take a sample from a population. The population is assumed to be very large (technically infinite). From the sample, you calculate a sample mean, which is an estimate of the true population mean. The estimate of the sample mean is better if 1) there is lower variability between samples (or low standard deviation) and 2) the more samples you take. Although different tests use different processes, they essentially assign a degree of uncertainty to the sample mean (similar, but more powerfully than the 95% Confidence Intervals we looked at last year). They then test whether the sample means can be considered different to one another. If they are, you can say that the means are 'significantly different'.
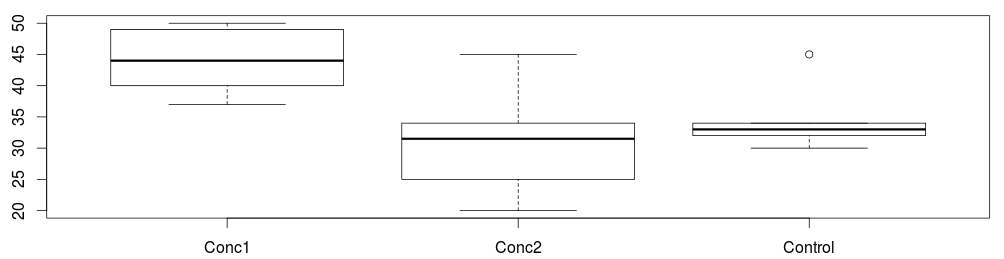
Note that there is no information on 'how' different the means are. The difference could be small, but still significant. The best way to examine this magnitude of difference is by plotting the data on a graph.
Tests to compare means depend on the number of categories or levels in your independent variable. For two levels, use a t-test, for more than two use an ANOVA. The same distinctions apply to non-parametric tests which compare medians. Again, for two levels there is a Mann Whitney U test, for three or more, a Kruskal Wallis test.
The data file for examples of running all of these tests is here for SPSS analysis and also as a .csv file here, for analysis in R.
Video of how to perform analysis in SPSS are here. They are split into two files, the first dealing with parametric statistics, the second dealing with non-parametric statistics. The first video tests the assumptions of parametric statistics, so is worth watching first, as the second follows on from this.
Video of how to perform analysis in R are here. They are split into two files, the first dealing with parametric statistics, the second dealing with non-parametric statistics. The first video tests the assumptions of parametric statistics, so is worth watching first, as the second follows on from this. You can download the R script file here.
Back Next
Don't forget to draw graphs of your data too. Either when exploring the data, or after the analysis. This allows you to examine the magnitude of difference between means, and lets you decide whether differences are likely to be important, even if they are statistically significant.
Other tests